CHEN Zhuoheng, YANG Chao, JIANG Chunqing, KOHLRUSS Dan, HU Kezhen, LIU Xiaojun, YURKOWSKI Melinda. Production characteristics and sweet-spots mapping of the Upper Devonian-Lower Mississippian Bakken Formation tight oil in southeastern Saskatchewan, Canada. PETROLEUM EXPLORATION AND DEVELOPMENT, 2018, 45(4): 626-635.
Editorial Office of Petroleum Exploration and Development
Production characteristics and sweet-spots mapping of the Upper Devonian-Lower Mississippian Bakken Formation tight oil in southeastern Saskatchewan, Canada
CHEN Zhuoheng1,*, YANG Chao2, JIANG Chunqing1, KOHLRUSS Dan2, HU Kezhen1, LIU Xiaojun1, YURKOWSKI Melinda2
A workflow that helps identify potential production sweet spots in the Middle Bakken tight oil play is proposed based on analysis of large amounts of production data. The proposed approach is a multivariate statistical model that extracts relevant information from a training dataset of production wells to facilitate geological similarity comparison between economic and sub-economic production wells. The model is applied to the Middle Bakken tight oil play in southeastern Saskatchewan. Data screening for diagnostic geological indicators for sweet spots reveals that several geological factors indicative for conventional oil reservoirs seem to work for the Middle Bakken tight oil play as well. These factors include: a) the NE Torqunay-Rocanville Trend serving as a preferred regional migration path for connecting mature source rock in southern Williston Basin and the Middle Bakken tight reservoir in southeastern Saskatchewan; b) the oils in the Bakken tight reservoirs along the U.S. and Canada border are more likely from local matured Bakken source rocks; c) subtle structural components enhancing the convergence of dispersed hydrocarbons over a large area; d) top seal and lateral barrier improving preservation, thus favouring oil productivity; e) orientation of maximum horizontal stress coincident with the direction of the variogram spatial continuity in ultimate recoverable reserves, so the direction of horizontal well has a significant impact on the oil productivity.
Key words:
tight oil reservoir; production characteristics; multivariate statistical model; production sweet-spot area; geological controls; Williston Basin
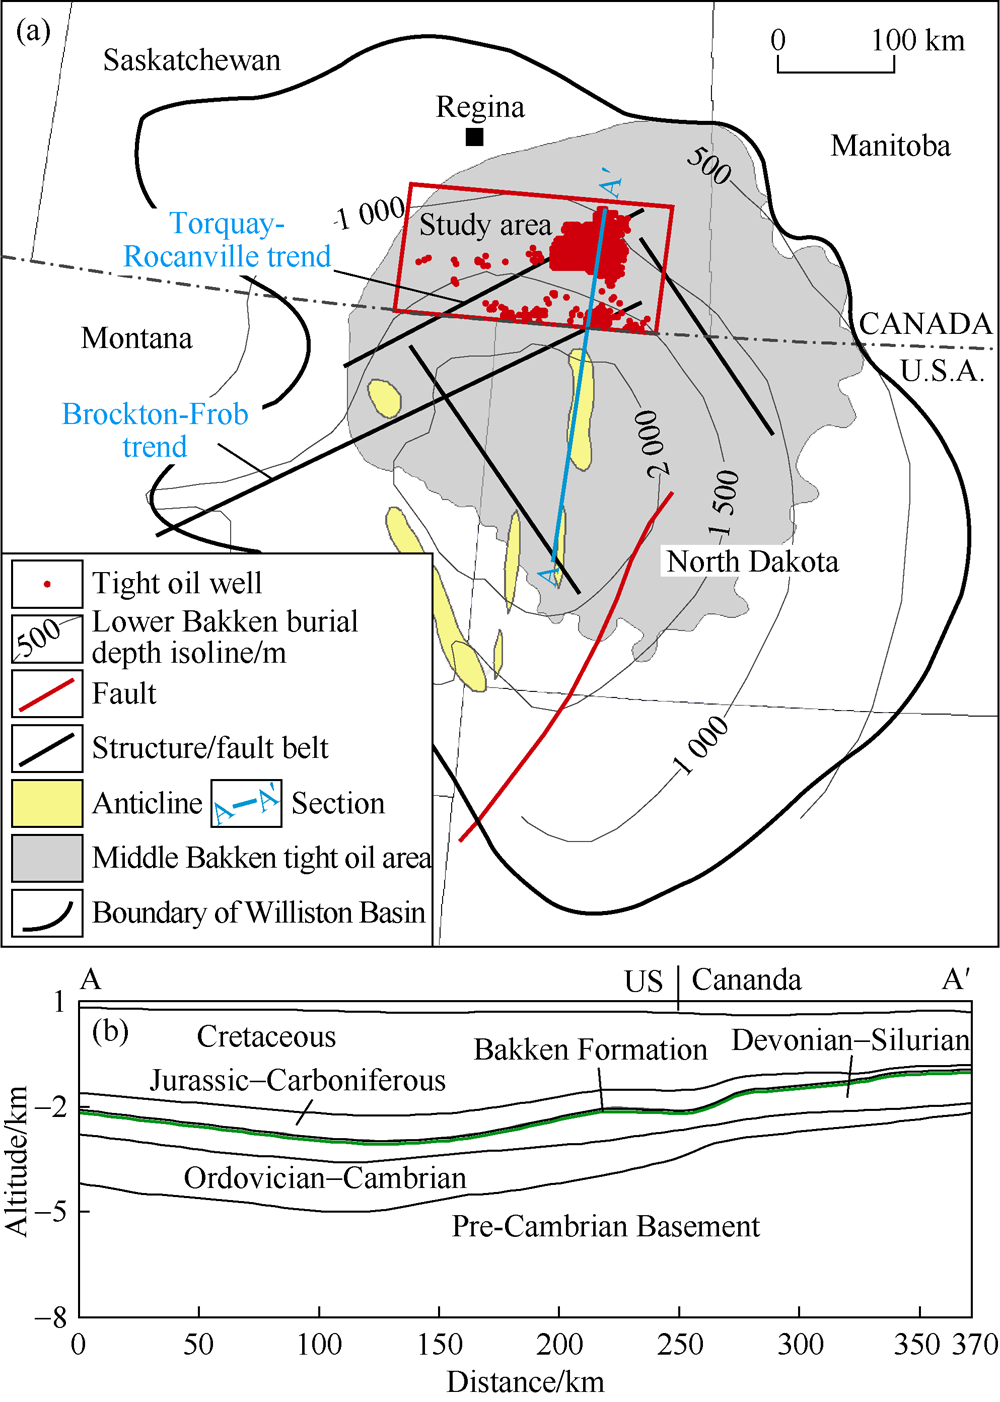
Oil production from the conventional Bakken reservoir in parts of southeastern Saskatchewan, Canada, started in the 1950s, with a low production of less than 100 m3/d. The economic success in the US Williston Basin has spurred a renewed interest in pursuing development of the Middle Bakken light oil resource in southeast Saskatchewan again (Fig. 1a). With the application of multi-stage hydraulic fracturing and horizontal well drilling, the oil production from the Bakken reservoir in that area has increased sharply from approximately 100 m3/day in 2004 to approximately 10 000 m3/day in 2014[1, 2]. An assessment of the tight oil resources in the Middle Bakken of southeast Saskatchewan by the National Energy Board and Saskatchewan Geological Survey (2015)[3] completed recently estimated 223 × 106 m3(1.4 × 10⁹ barrels) of marketable oil and 81.2 × 10⁹ m3 (2.9 TCF) of marketable natural gas[3]. Finding out the distribution of the economically recoverable resources in the Bakken tight reservoir of this area is of great significance for ensuring future oil production growth in the region. In this area, tight/shale reservoirs are regionally pervasive, but strongly heterogeneous. With current technologies, only the resources with high abundance in areas with favorable reservoir properties and rock mechanics— called ‘ sweet spots’ — can be developed profitably at an industrial scale[4, 5, 6]. So far, the oil producing wells of the Middle Bakken Member in southeast Saskatchewan are concentrated in the known Viewfield sweet spot, although there are a few other isolated oil wells near the US border and other places. The distribution of potential sweet spots in this area is not clear; therefore, outlining the distribution and range of economically viable resources in the Middle Bakken Member and quantifying the uncertainty associated with the sweet spots can not only reduce economic risk but also environmental footprints by minimizing the number of sub-economic wells drilled. Several methods have been proposed for delineating production sweet spots in unconventional plays[4, 6, 7]. As the geological controls for commercial oil occurrence in the tight/shale reservoirs are not fully understood[8], the classic theories and simulation techniques applied to evaluating recoverable factors for conventional reservoirs have proven inadequate for tight reservoirs[9, 10, 11]. The unique characteristics of each tight reservoir should be considered comprehensively in defining the sweet spot. Therefore, a multivariate-Bayesian based statistical method for sweet spot prediction has been proposed based on the quantitative relationship between the production of oil wells and geological elements. The method has been used to analyze the geological factors affecting the formation and accumulation of tight oil in the study area.
Fig. 1. (a) Map showing tight oil reservoir production wells (red areas) within the southeastern Saskatchewan study area (red rectangle) in the Williston Basin. (b) N-S cross-section showing general characteristics of the Williston Basin.
2. Data and methods
2.1. Data available to this study
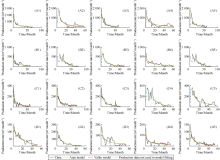
In this study, we define a tight reservoir as a clastic reservoir with very low permeability, from which commercial production cannot be achieved without stimulation measures such as horizontal well drilling and multi-stage hydraulic fracturing. By December 2014, more than 3000 horizontal wells had been completed with multiple-stage hydraulic fracturing in the Middle Bakken tight reservoir in the study area (Fig. 1). After wells with less than one-year production records and unstable production profiles were eliminated through quality control (QC) screening, a total of 2111 production wells remain available for further production decline analysis. Fig. 2 shows the production curves of representative wells of different productivities in the study area. The Geological Survey of Canada and the North Dakota Geological Survey provided geochemical data, primarily from programed pyrolysis for both Canadian and the US sides of the border. Volumetric data, including reservoir thickness, porosity and oil saturation and their spatial variations presented in map forms, provide reservoir parameters necessary for estimating the in-place resources. Additional regional geological data, such as the thicknesses of the Upper Bakken and Lower Bakken shale members, surface elevation, structural map of the Middle Bakken reservoir, formation water salinity, reservoir permeability, among others in this study, were provided by the Saskatchewan Geological Survey.
Fig. 2. Oil production curves of wells with various productivities from the Middle Bakken tight oil pools in the Williston Basin of southeastern Saskatchewan. The top performers of oil production are represented by production curves in A1 to A5 (initial production > 1 500 m3/month); middle level performers by B1 to B5 (initial production around 500 m3/month); low level of performers from C1 to C5 (500 m3/month > initial production > 200 m3/month). The groups of D1 to D5 are wells below commercial production rate.
2.2. Statistical model
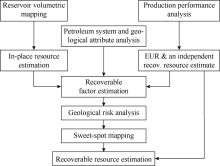
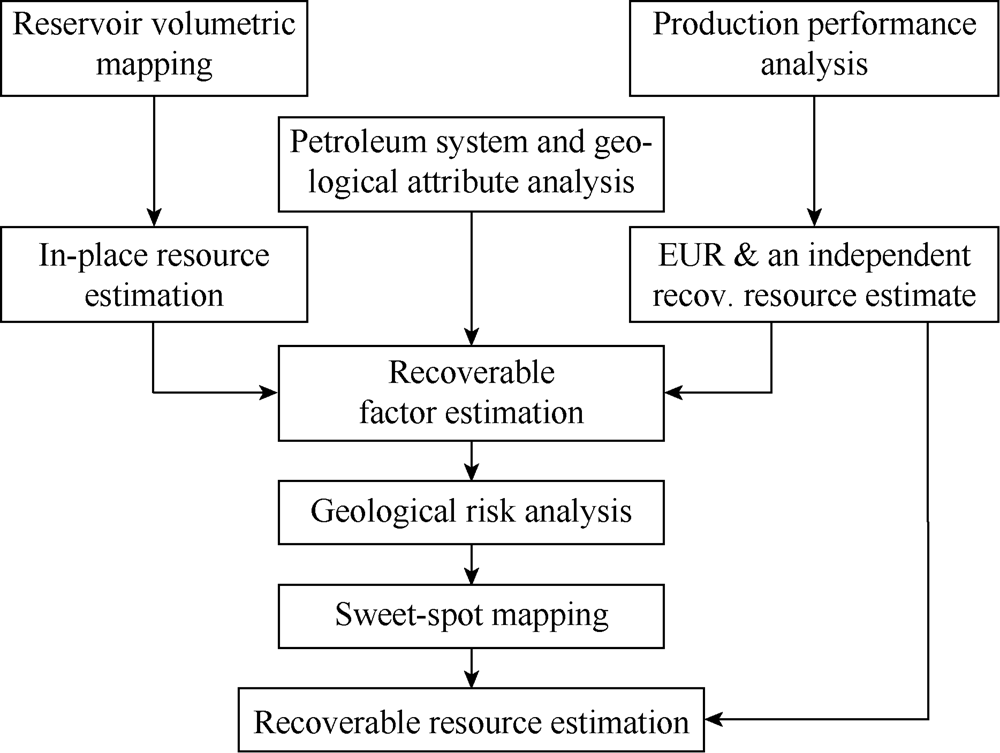
The method presented in this study for sweet-spot mapping is an integrated statistical approach which regards the geological risk as a problem of two-category classification with uncertainty, and employs multivariable and Bayesian statistics to perform the classification[12]. Fig. 3 shows the major components and work flow of the method. The uncertainty associated with the classification is measured as the probability of occurrence of a commercial oil production well at a target drilling site. Suppose that this play has n production wells. According to the estimated ultimate reserves (EURs), the wells can be divided into two groups: well group E with economic production rate, and group F with sub-economic rate, representing the observations from the two populations, respectively. Based on the n wells and other available geoscience information, we try to determine the probability that an untested well site belongs to one of the two defined populations. The probability can be formulated using a conditional probability method upon m geological variables. Let G(r) denote the random vector of m geological variables containing information on the classification, and g(r) be the assumed values for variable G(r). The conditional probability that, for given observations G(r)=g(r), the well at location r belongs to E can be written as:
$P\left[ E\left| g\left( r \right) \right. \right]=\frac{P\left[ E, g\left( r \right) \right]}{P\left[ g\left( r \right) \right]}$ (1)
where P[E, g(r)] is the joint probability of productive well (E), and observations [G(r)=g(r)]; and P[g(r)] is the probability of G(r)=g(r).
Fig. 3. A flow chart showing the major components and workflow of the proposed sweet-spot mapping of tight oil in the Middle Bakken Member, southeastern Saskatchewan.
To avoid the complexity in multivariable Bayesian conditional probability computation, we used conventional multivariate statistics to generate a classification scheme first, then used the Bayesian method to derive the conditional probability. In this study, we performed the classification of the two types of well site using Mahalanobis Distance (MD). The MD is a multivariate statistical measure of the distance between a point and a population in multivariable space. Let X denote the geological data matrix consisting of p observations and m variables. The geological favorability of a well site with capacity of economic production is measured as the MD, which is expressed as[13]:
MD=(Xk-XE)TSE-1(Xk-XE) (2)
where Xk is the kth row vector of X, or the kth observation; Xa is the mean vector of the training data set (wells in group E); and (…)T is the transposed matrix (the general characteristics of the economic production well sites in group E), and SE is the covariance matrix of the training data set. Graphically, the MD is a standardized square distance between the geometric center of the group with economic production and an untested drilling site relative to their geological characteristics in a multivariate space.
Using MD as the measure of classification, the conditional probability in Eq. (1) can be rewritten as:
$P\left[ E\left| D\left( r \right) \right. \right]=\frac{P\left[ E, D\left( r \right) \right]}{P\left[ D\left( r \right) \right]}$ (3)
2.3. Volumetric calculation
To capture the spatial variability of the resource potential in the target reservoir, the study area is divided into N equal sized cells with location index of r. The total hydrocarbon pore volume (Vo) in the reservoir can be estimated by summing up the resources in each of the N cells using the following volumetric equation:
${{V}_{\text{o}}}=\sum\nolimits_{r=1}^{N}{s\left( r \right)}h\left( r \right)\phi \left( r \right){{S}_{\text{o}}}\left( r \right)$ (4)
where s(r) is the cell size (m2); h(r) is the reservoir thickness (m); ϕ (r) is reservoir porosity (expressed as a fraction); and So(r) is oil saturation (in fraction). Because there is no free gas at reservoir conditions in the study area, the hydrocarbon pore volume is actually the oil pore volume. A variogram model of geostatistics based on volumetric parameters was derived from the data and applied to characterizing the spatial variation of the resource. The oil pore volume in reservoir conditions was converted to resource potential under standard surface conditions using the standard equation for conventional reservoir[14]. A Monte Carlo simulation algorithm was then used to combine resources from the resource map to derive a total resource in the study area and capture the uncertainty of the resource estimation in a spatial extrapolation.
2.4. Estimated ultimate recovery (EUR) and recoverable resource
For each production well, historical production records were fitted to a decline model, then the production of each well was extrapolated to 30 years according to the decline model to estimate the ultimate recoverable reserves of each well. In this study, two production decline models, the Arps and Valko models[15, 16] were adopted. The Arps model was proposed to predict production decline in conventional reservoirs, so when applied to unconventional tight reservoirs, it could overestimate the EURs[17]. The Valko model (also known as stretched exponential model), designed for unconventional reservoirs, can better characterize flow behavior in unconventional reservoirs[16, 18]. Our experience shows that the ‘ best-fit’ results of the Valko model fluctuate less with extended production times, and the results of sensitive test show the EURs predicted by this model are closer to the actual values. Therefore, in this study, the Valko model was used to predict EURs of individual wells, while the results obtained from the Arps model were only used as reference and for comparison.
3. Geologic setting and production features of tight oil
3.1. Geological setting
The Williston Basin is a cratonic basin (Fig. 1) constituting two major sedimentary packages: (1) the Paleozoic carbonate and evaporate system, and (2) Mesozoic and Cenozoic siliciclastic system[19]. The Bakken Formation from the top of the Devonian to the lower Mississippian is a set of proven source rocks and the major source for oil and gas in Carboniferous-age and overlying formations[21, 22, 23, 24, 25, 26], so it has been the major interval of oil and gas exploration and development in the basin[27]. Schmoker and Hester[28] thought that the proven reserves in the conventional reservoirs of the basin only accounted for a small portion of the oil and gas expelled from Bakken Formation shale. The idea that the natural fractures must contain rich oil and gas resources has been motivating people to try to produce oil and gas from Bakken shale with horizontal wells and artificial fracturing. The emergence of horizontal well drilling combined with multi-stage fracturing provides a feasible means for the recovery of tight oil from the Bakken Formation[27, 28, 29, 30].
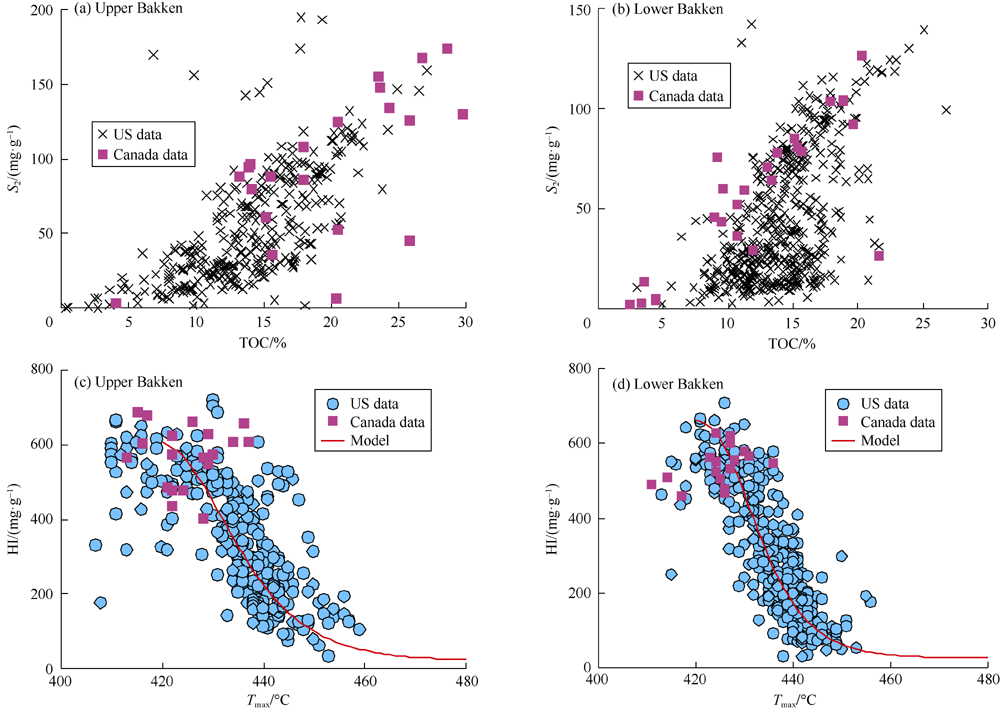
The Bakken Formation is divided into three members, of which the middle member, made up of siltstone and fine sandstone interbeds, is tight reservoir held between organic-rich black shale of upper and lower members. The black shales of the upper and lower members are widespread in the basin[20, 22, 25] and thickest (more than 20 m) at the basin center, representing typical marine source rock[31], with measured total organic carbon (TOC) content from < 1.0 to 30% (Fig. 4), and average TOC of 11.77% and 17.63%, respectively (Fig. 4a and 4b). The remaining oil generation potential revealed by hydrogen index (HI) decreases with the increase of thermal maturity (Tmax). The initial HI is likely more than 600 mg HC/g TOC (Fig. 4c and 4d). Due to shallow burial depth in the Canadian portion of the Williston Basin, the Bakken black shales are not thermally mature enough to generate large amounts of oil and gas[25, 32]. All samples from the Canadian portion of the Williston Basin fall at the beginning of the thermal decomposition trajectory on the Tmax-HI cross-plots (Fig. 4c and 4d), suggesting the samples are immature to low maturity. The research results of Stasiuk[33] show the vitrinite reflectance of the samples (Ro) ranges between 0.34% and 0.68%, consistent with the maturity of the source rock as indicated by Tmax. There are several faults/faulted zones related to basement structures in the Williston Basin[19], of which some are probably dominant channels for oil migration from south to north[32].
Fig. 4. (a, b) Rock Eval data demonstrating the general characteristics of the source rock in the lower and upper Bakken members. TOC versus S2 plots showing the quality and richness of the source rock in the lower (a) and upper (b) members. (c, d) Hydrogen index (HI) versus Tmax showing the remaining oil generation potential with thermal maturity of the lower (c) and upper (d) members.
The Middle Bakken member in southeastern Saskatchewan has been subdivided into 3 sublayers, Unit A, Unit B and Unit C[34, 35]from bottom to top. Conformably overlying the Lower member Bakken[34, 35], the Unit A consists of massive grey to greenish grey argillaceous dolomitic siltstone to silty dolostone, with many signs of bioturbation. Coarsening gradually upward, the siltstone at its top is the main interval for oil and gas accumulation. Unit B is made up of fine calcite-cemented sandstone. Unit C is composed of laminated argillaceous dolomitic siltstone with pervasive signs of bioturbation and soft-sediment deformation.
3.2. Reservoir characteristics
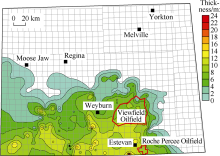
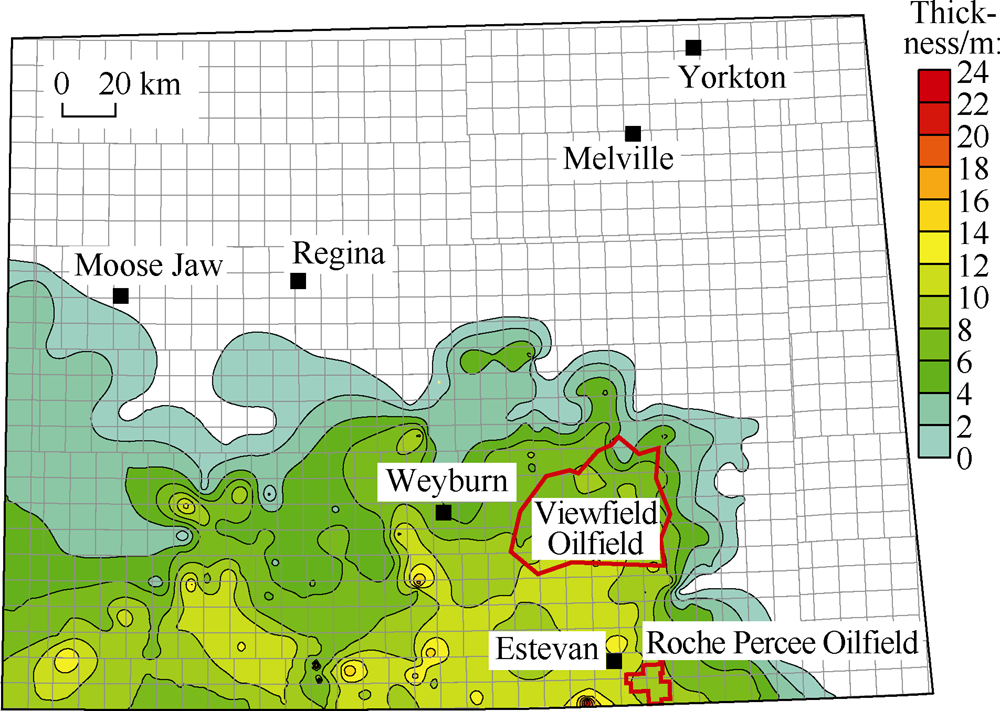
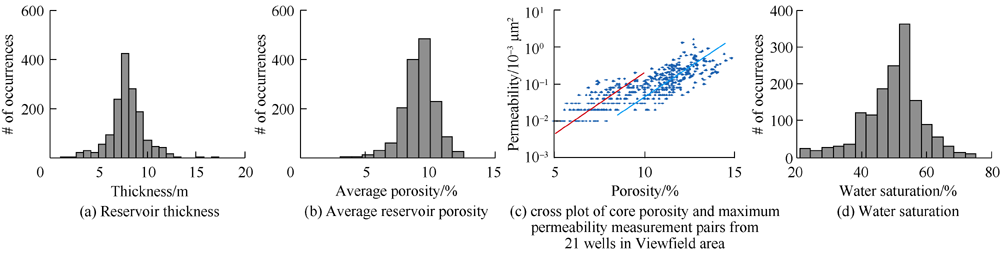
This study focuses on Unit A in southeastern Saskatchewan. This unit is widespread in the study area (Fig. 5), but varies greatly in thickness, from less than one meter to over 10 meters (Fig. 6a). The reservoirs have an average porosity from 4% to 13% (Fig. 6b). The cross-plot of porosity and permeability of core samples from 21 wells in the Viewfield area shows two data clusters with different trends (Fig. 6c), suggesting that there are geological factors affecting the low permeability of the tight oil zone other than formation heterogeneity. Water saturation varies widely in the area, and that of most samples falls between 40% and 60% (Fig. 6d).
Fig. 6. Reservoir properties of the Middle Bakken tight oil pool in southeastern Saskatchewan, Canada.
3.3. Oil production characteristics
Production data for the Middle Bakken Unit A tight oil reservoir in 2111 oil wells was analyzed. Statistics show most of the wells have a horizontal section of 1 500 m and pay depth of around 1 600 m. The burial depth of the target horizon increases southward as the strata dip toward the basin center (Fig. 1b).
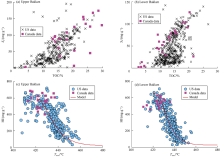
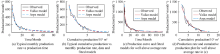
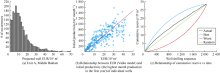
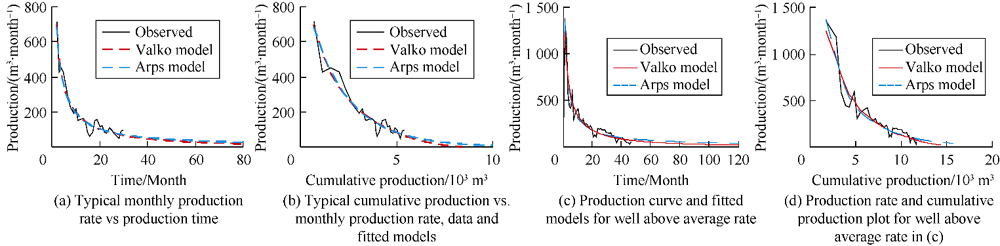
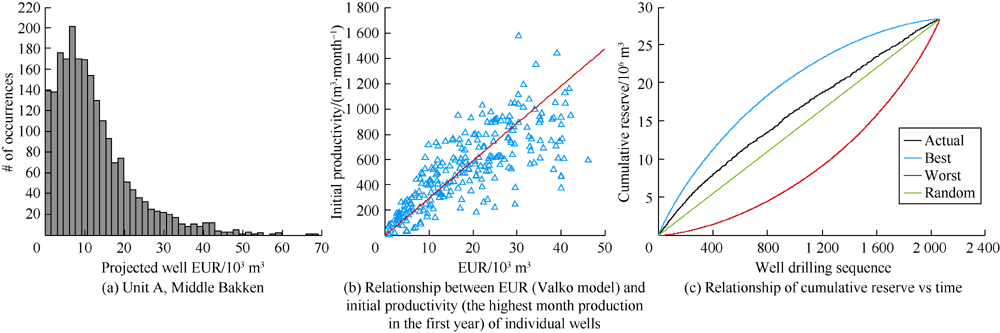
The production from 2111 wells with time were fit to Valko and Arps models, and the decline models obtained were extrapolated 30 years to get the EURs of the 2111 wells. Fig. 7 shows two examples of fitted data and extrapolated production representing wells with average production (Fig. 7a and 7b) and wells with production higher than the average level (7c and 7d). The histogram of EURs from 2111 production wells shows the statistics of the EURs of these wells (Fig. 8a), which has a median of around 9.0× 10³ m3 and an average value of 10.3× 10³ m3. Parameters and characteristics of Unit A reservoir are shown in Table 1. It can be seen that the EUR and initial productivity of a well have good correlation (Fig. 8b); the higher the initial productivity, the larger the EUR of the tight oil layer after 30 years of production.
Fig. 7. Production performance (black) and modelled production decline curves (red: Valko, blue: Arps) of the Middle Bakken Unit A tight reservoir in southeastern Saskatchewan.
Fig. 8. A histogram showing the distribution of the well EURs from recent horizontal oil wells with multi-stage hydraulic fracturing in the Middle Bakken Unit A tight reservoir in southeastern Sasktchewan.
Table 1
Table 1
Table 1 Statistics of reservoir parameters and production characteristics of Unit A in Saskatchewan.
Variables
Porosity/%
Water saturation/%
Reservoir thickness/m
Hydrocarbon pore volume in unit area (HCPV)/(m3• m-2)
Mean
9.209
49.788
7.950
0.362 0
Variance
1.480
82.107
2.722
0.010 7
Variables
Estimated ultimate recovery (EUR)/m3
Oil recovery/%
Formation volume factor (FVF)
Gas to oil ratio/ (m3• m-3)
Mean
12 719
8.690 0
1.25
121.5
Variance
9.58× 10⁷
0.003 1
6 765.0
Table 1 Statistics of reservoir parameters and production characteristics of Unit A in Saskatchewan.
Sluijk and Parker (1985)[36] used a creaming curve to measure the exploration drilling efficiency of different drilling strategies in conventional petroleum exploration. The technique was used in this study to quantify the relationship between drilling order and production performance. The EURs of 2111 wells were plotted in four different ways (Fig. 8c). The blue line plots the EURs from the largest to the smallest, representing the most efficient way of drilling; while the red line plots the EURs from the smallest to the largest, the worst order of drilling. The green line shows the results of a random drilling sequence. The actual drilling order, the black line, lies between the most efficient and random drilling sequences, suggesting that the actual drilling sequence is better than a random drilling sequence, that is, the EURs of wells would affect the drilling sequence. This also reflects the general rule in the development of unconventional oil and gas, namely, when drilling is moving away from the most productive area in the center of a sweet spot to the margins, the production of wells generally decreases gradually. This also suggests that the production wells should be deployed in the site with the highest possibility of success and EUR.
4. Sweet spot mapping
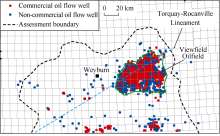
For mapping purposes, a ‘ sweet spot’ here is defined as the portion of a tight reservoir that has commercial development value by horizontal well drilling and multi-staged fracturing. The 2111 wells used in this study were divided into two groups according to their EUR. More specifically, production wells with EUR ≥ 3 000 m3 (18, 870 barrel/well) of oil were regarded as economic wells in sweet spot areas, and wells with EUR < 3 000 m3 were sub-economic wells in non-sweet spot areas. Fig. 9 is a map showing the spatial distribution of the two types of production wells in the study area. Most of the economic production wells are in the central area of the Viewfield pool. There are a small number of economic production wells scattered along the US-Canada border, and in the west part of the study area.
Fig. 9. Map showing locations of economic and sub-economic production wells of Middle Bakken tight reservoir in southeastern Saskatchewan.
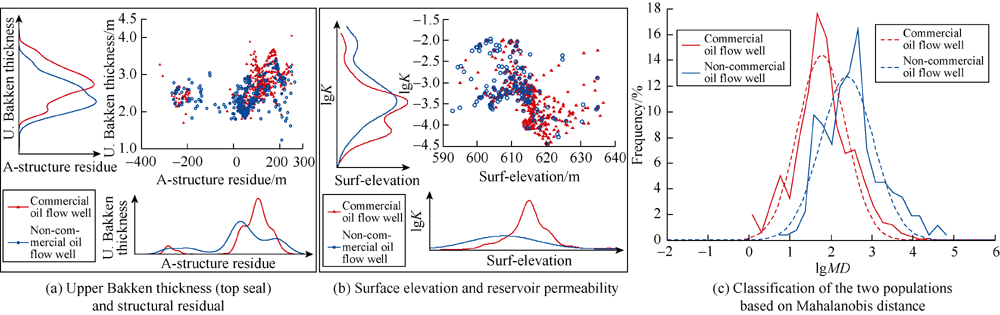
Another key step of sweet spot mapping is to find geological factors capable of separating economic production wells from sub-economic wells. Petroleum system elements and regional geological variables, such as structural residue (difference between the structure and regional trend), surface elevation, formation water salinity, thickness of the upper and lower Bakken shale units, reservoir porosity, permeability and others were collected for analysis. This regional study reveals that the majority of Bakken shale on the Canadian side of the Williston Basin hasn’ t entered the oil generation window yet, and the oil in the tight Bakken reservoir is most likely sourced from the central part of the basin, therefore, geochemical parameters of source rocks in the study area, like maturity and abundance of organic matter, were not selected for study. Fig. 10 shows two examples of data screening, demonstrating the way of selecting diagnostic geological parameters. A quantitative measure using Bayesian criterion for each of the variables under screening was derived and used to select variable for establishing the multivariate statistical model and probability calculation. Chen and Osadetz[12] discussed the details of the Bayesian approach for deriving quantitative measurements for selecting diagnostic variables, so repetitious details aren’ t given here in this paper.
Fig. 10. Examples of geological variable screening for discriminating high rate from low rate wells in southeastern Saskatchewan.
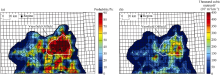
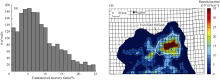
Altogether, eight parameters (thickness of the Upper Bakken, thickness of Middle Bakken Unit A tight reservoir, structure residue, formation water salinity, surface elevation, reservoir porosity, pressure gradient, and permeability) were selected and used to construct a statistical model to classify the production wells (Fig. 10). The results from the classification were evaluated by the Bayesian model (Eq. (3)) to perform probability calculations (risk). The sweet spot mapping in this study is equivalent to determining the probability that an untested well site produces economic oil flow based on its geological similarity to the sites of known economic oil producing wells. The Bayesian model was applied to spatially referenced map data to calculate the probability of economic production rate at each cell in the study area, and the probability of economic oil occurrence map obtained is shown in Fig. 11a. The higher the probability, the more likely the well will tap industrial oil flow. This probability map was then used to adjust the initial hydrocarbon-in-place estimate from volumetric calculations to derive a risked-resource abundance map (Fig. 11b). The risked oil-in-place resource map shows the parts with high resource abundance in the study area are concentrated in the Viewfield pool zone, while there are a few other small potential sweet spots scattered across the study area. It should be noted that the areas with high in-place resource abundance derived from volumetric parameters are not necessarily coincident with the sweet spots of high productivity indicated by well performance, because resource abundance is not the only factor controlling oil productivity in unconventional tight oil plays. Thus, the initial in-place resource potential may not be directly proportional to economically recoverable resource.
Fig. 11. (a) Probability of commercial oil production of the Unit A tight oil play. (b) A risked-resource abundance map of oil-in-place for Unit A tight oil play in the Middle Bakken Member, southeastern Saskatchewan.
Fig. 12a shows the distribution of estimated recovery factor; that is, the ratio of well EUR to risked oil-in-place in the drainage area of the well. The estimated recovery factor displays a two-mode distribution, which indicates that there may be reservoirs with two kinds of characteristics in Unit A. A small portion of the wells show higher recovery factors, around 14%, whereas the majority of the wells exhibit a lower recovery factor of 6% on average. Multiplication of the risked oil in-place and the estimated oil recovery factor yields a risked recoverable oil resource map of the Unit A tight oil play in the study area (Fig. 12b), which shows the distribution of potential sweet spots in the tight oil play. The combined recoverable oil and solution gas resources are 0.22 × 10⁹ m3 and 34.22 × 10⁹ m3, respectively (Table 2).
Fig. 12. (a) Histogram of estimated recovery factor derived from the ratio of EUR to risked oil-in-place estimated using the volumetric method. (b) A risked-resource abundance map of oil in-place.
Table 2
Table 2
Table 2 Estimated recoverable oil and associated gas resources in the Unit A tight oil play of the Middle Bakken Member, southeastern Saskatchewan, Canada.
Probability/%
Recoverable oil resources/109 m3
Recoverable gas resources/109 m3
95
0.06
2.52
90
0.08
4.16
75
0.12
9.23
50
0.19
20.37
25
0.29
42.37
10
0.42
77.71
5
0.51
109.72
Average
0.22
34.22
Table 2 Estimated recoverable oil and associated gas resources in the Unit A tight oil play of the Middle Bakken Member, southeastern Saskatchewan, Canada.
It is noteworthy that the estimated resource potential in the Middle Bakken tight reservoir does not consider application of enhanced recovery techniques. Recent study[37] indicates that water flooding could be effective in enhancing recovery of the Middle Bakken tight oil reservoir. Simulation of CO2 injection to Bakken tight reservoirs suggested that three cycles of CO2 injection in 30 years could raise the oil recovery factor by 2.43%[38].
5. Factors controlling the distribution of tight oil
Through examining the sweet spots in the tight oil play of the Middle Bakken Unit A in southeastern Saskatchewan, we have reached the following findings on the formation of tight oil reservoirs there: Organic geochemical analysis of crude oil samples from the Middle Bakken Member of the Viewfield area indicates that the tight oil is genetically related to the Bakken shale (e.g., with similar high abundance of arylisoprenoids, pristane-over-phytane ratio greater than one, and dibenzothiophenen-over-phenanthrene ratio less than one), in other words, the oil in Unit A comes from Bakken shale. But the average GOR of the reservoir is 120 m3/m3, which implies the source rock maturity measured by vitrinite reflectance should be more than 0.8%[39]. As the most mature Bakken shale in the Canadian Williston Basin— located in the southernmost region of the study area close to the US border (Fig. 5)— has a vitrinite reflectance of 0.68%, it is inferred that the light oil in Unit A of the Middle Bakken in the Viewfield pool must have migrated primarily from the thermally mature Bakken shale in the US portion of the Williston Basin, while the oil in the tight reservoirs along the US— Canada border is more likely from local mature Bakken source rock. The modelled hydrocarbon saturation in the Middle Bakken along the US— Canada border could be up to 80%[31], which is adequate for oil accumulation.
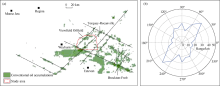
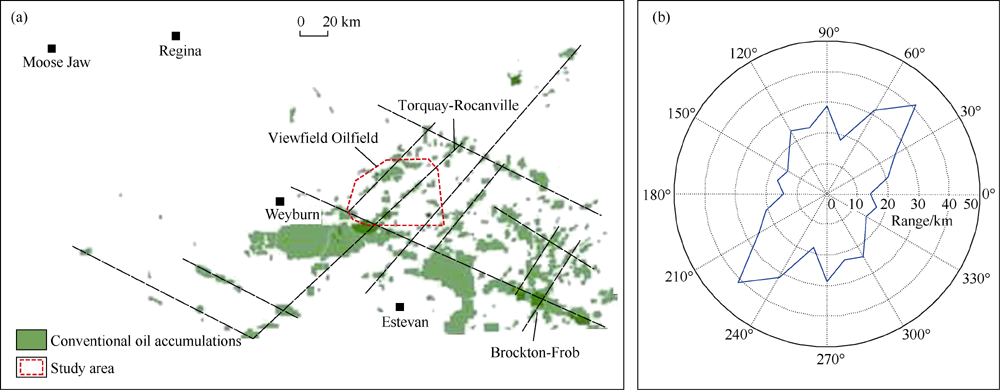
Besides unconformity surfaces and regional carrier beds, fracture/fault systems provide another kind of flow path. Many signs show the fractures/fault systems in the region are probably the preferred migration network connecting mature source rock in the south with the reservoir in the north of the study area. First, the conventional oil discoveries, not limited to the Bakken oil, align linearly in two major orientations: NW and NE; that is, coincident with regional lineament/fault zones (Figs. 1 and 13a). This suggests that oil and gas are enriched throughout the linear features that either provide storage space or form traps along regional migration pathways of hydrocarbon fluids. Chen et al. (2009)[32] studied the geochemical evidence of migration of Bakken and the overlying Carboniferous Lodgepole sourced oils. They found oils in conventional accumulations in Canada’ s Williston Basin have high geochemical similarity with Bakken source rocks, and the oil might migrate along the Torquay-Rocanville Trend (TRT Lineament) toward the north[32], which passes right through the Viewfield oilfield. Moreover, scattered high EUR wells are distributed along the TRT zone linearly (Fig. 9), supporting the projection that the TRT serves as the preferred migration path for the Bakken source oil. Second, our geostatistical model also supports this inference. The spatial variation of variable continuity revealed by the empirical directional variogram model suggests that the best spatial continuity for well EUR in the Viewfield tight oil pool is in a NE direction, consistent with the strike of the Torquay-Rocanville Trend (Fig. 13b). Third, in Fig. 13a, it appears that there are two predominant directions of alignment in oil accumulation, NE and NW; the direction of NE is coincident with the direction of the maximum regional horizontal stress field[40], and the fractures parallel with the direction of maximum regional horizontal stress field are likely to remain open under the effect of the stress field, which is conducive to oil migration along this direction. If the TRT has served as the preferred migration route for Bakken mature oil, then the southwest extension of the current production sweet spots in Viewfield and other NW lineament zones could be potential areas for searching for future high EUR wells. As the thermal maturity of the source rock increases southward, the US-Canada border area could be another area for high EUR wells.
Fig. 13. (a) Relationship between spatial distribution of conventional oil accumulations in southeastern Saskatchewan, Canada. (b) Rose diagram showing variation of the range (a parameter in variogram indicating spatial continuity of the variable studied), suggesting NE is the direction of most continuity of high oil EUR wells in the Viewfield pool, which is coincident with regional and local lineaments and the direction of maximum horizontal regional stress.
Apart from the source rock maturity and preferred migration route, we noticed some other regional geological factors which may affect tight oil accumulation in this area. Firstly, the thickness of Upper Bakken shale seems to be a good indicator of high EUR wells (Fig. 10a), suggesting that an effective top seal is critical for the formation of significant oil accumulations in the area. Secondly, positive structural residue is positively correlated to productivity (Fig. 10a). This is coincident with the fact that locations of high production wells are of higher elevation (Fig. 10b), implying that buoyancy is the dominant force for hydrocarbon migration and accumulation. Thirdly, in conventional reservoirs, hydrocarbon saturation is positively correlated with porosity and permeability, low capillary force is helpful to the displacement of formation water by oil, facilitating oil accumulation. In this study, the situation is the opposite, that is, high EUR wells are found in locations with lower permeability (Fig. 10b). This may indicate that lateral lithological barriers are important for the for- mation of commercial oil accumulations in the tight reservoir. Chen et al.[32] demonstrated that interbedding of thin silty and muddy shale was favourable for the enrichment and preservation of gas in the environment where the natural gas generation and escaping were in a dynamic equilibrium. This may be also true of the tight oil plays where lateral and vertical seals are weak.
6. Conclusions
A workflow of mapping production sweet spot was proposed and applied to the Middle Bakken Unit A tight oil play in southeastern Saskatchewan. The approach establishes a multivariate statistical model based on a training dataset of 2111 production wells that facilitates geological similarity comparison between two distinct production groups. The criteria established in the model through the training dataset is then applied to calculate the probability of encountering economic oil flow at an untested well location in the map area, based on geological affinities with the training dataset.
The resulting sweet spot mapping yields a probability map showing the likelihood of hydrocarbon occurrence across the tight oil play. Combined with the assessment from volumetric approach and well EURs, this leads to a resource map that shows recoverable oil and its spatial variation in the tight oil play.
The sweet spot mapping via screening of diagnostic geological variables for high oil EUR wells leads to recognition of several regional geological factors that may be important for understanding the formation and occurrence of oil accumulations in the tight oil play. These factors include: a) the NE Torquay-Rocanville Trend may serve as a preferred regional migration path of Bakken sourced oils though migration paths in other directions and channels may exist; b) the oils in the Bakken tight reservoirs along the U.S. and Canada border are more likely from local matured Bakken source rocks; c) subtle structural components enhance the convergence of dispersed hydrocarbons over a large area; d) effective top seal and lateral barrier improve the preservation, thus favoring oil productivity; and e) the direction of the variogram spatial continuity of well EUR is consistent with the orientation of the maximum horizontal stress field, indicating that the regional stress field plays an important role in oil productivity.
Acknowledgements
This is an output from the Geoscience for New Energy Supply (GNES) Program of Natural Resources Canada. The Program of Energy Research and Development (PERD) funded this study. Drs. Edward Little and Omid Haeri Ardakani of the Geological Survey of Canada, and Heather Brown of Saskatchewan Ministry of Energy and Resources are thanked for their useful comments and suggestions for improving the quality of this paper.
Nomenclature
s— area of the evaluated zone, m2;
D(r)— MD distance between the geometric center of the known well group E with economic oil flow and the well site to be drilled;
g(r)— observed value of G(r);
G(r)— a random vectors of m geological variables containing information of two types of production wells;
K— permeability, 10-3 μ m2;
m— number of geologic variables;
n— number of production wells;
N— cell number of the study area;
p— number of observations ;
P[E, g(r)]— joint probability of G(r)=g(r) belonging to E group;
P[g(r)]— probability of G(r)=g(r);
r— spatial location label in the study area, 1 to N;
So— oil saturation, %;
SE— covariance matrix of the training dataset;
h— reservoir thickness, m;
Voil— total initial oil-saturated pore volume in the tight reservoir, m3;
XE— average vector of the training data matrix;
Xk— vector of the Kth line of the X matrix;
X— geologic data matrix composed of p observed values and m variables;
ϕ — reservoir porosity, %.
The authors have declared that no competing interests exist.
CHENZ, HANNIGANP. A shale gas resource potential assessment of Devonian Horn River Strata using a well-performance method. Canadian Journal of Earth Sciences, 2016, 53(2): 156-167. [Cited Within:1]
MCGLADEC, SPEIRSJ, SORRELLS. Methods of estimating shale gas resources: Comparison, evaluation and implications. Energy, 2013, 59: 116-125. [Cited Within:2]
[5]
MAUGERIL. Comment: Beware of break-even and marginal-cost analyses. Oil & Gas Journal, 2015, 3(1): 50-58. [Cited Within:1]
[6]
WANGS, YUY, GUOQ, et al. New advances in the assessment of tight oil resource in China. Petroleum Research, 2017, 2(1): 1-12. [Cited Within:2]
[7]
CHENZhuoheng, OSADETZ KG. An assessment of tight oil resource potential in the Upper Cretaceous Cardium Formation, Western Canada Sedimentary Basin. Petroleum Exploration and Development, 2013, 40(3): 320-328. [Cited Within:1]
[8]
JIAC, ZHENGM, ZHANGY. Some key issues on the unconventional petroleum systems. Petroleum Research, 2016, 1(2): 113-122. [Cited Within:1]
BUI BT, TUTUNCU AN. Contribution of osmotic transport on oil recovery from rock matrix in unconventional reservoirs. Journal of Petroleum Science and Engineering, 2017, 157: 392-408. [Cited Within:1]
[12]
CHENZ, OSADETZ KG. Geological risk mapping and prospect evaluation using multivariate and Bayesian statistical methods, western Sverdrup Basin of Canada. AAPG Bulletin, 2006, 90(6): 859-872. [Cited Within:2]
[13]
MARDIA KV, KENT JT, BIBBY JM. Multivariate analysis. New York: Academic Press, 1989. [Cited Within:1]
[14]
CHENZ, LAVOIED, JIANG MM, et al. A dual-porosity model for evaluating petroleum resource potential in unconventional tight-shale plays with application to Utica Shale in Quebec, Canada. Marine and Petroleum Geology, 2017, 80: 333-348. [Cited Within:1]
VALKO PP, LEEJ. A better way to forecast production from unconventional gas wells. SPE 134231 -MS, 2010. [Cited Within:2]
[17]
ILKD, CURRIE SM, SYMMONSD, et al. Hybrid rate-decline models for the analysis of production performance in unconventional reservoirs. SPE 135616 -MS, 2010. [Cited Within:1]
[18]
LEE WJ. Production forecast, reserves estimations and reporting rules for unconventional resources. Calgary, AB, Canada: SPE Canadian Unconventional Resources Conference, 2012. [Cited Within:1]
[19]
GERHARD LC, FISCHER DW, ANDERSON SB. Petroleum geology of the Williston Basin. In: LEIGHTON M W, KOLATA D R, OLTZ D F, et al. Interior cratonic basins. Tulsa: AAPG, 1990: 509-559. [Cited Within:2]
[20]
DOW WG. Application of oil-correlation, and source-rock data to exploration in Williston Basin. AAPG Bulletin, 1974, 58(7): 1253-1262. [Cited Within:1]
[21]
MEISSNER FF. Petroleum geology of the Bakken Formation, Williston Basin, North Dakota and Montana. Montana: the Montana Geological Society’s 24th Annual Conference, 1978. [Cited Within:1]
[22]
DEMBICKI HJ, PIRKLE FL. Regional source rock mapping using a source potential rating index. AAPG Bulletin, 1985, 69(4): 567-581. [Cited Within:2]
[23]
KREIS LK, COSTAA. Hydrocarbon potential of the Bakken and Torquay formations, southeastern Saskatchewan. Saskatchewan: the 13th Williston Basin Petroleum Conference, 2005. [Cited Within:1]
[24]
BURRUSJ, OSADETZ KG, WOLFS. Geochemical and numerical modelling constraints on oil expulsion and accumulation in the Bakken and Lodgepole petroleum systems of the Williston Basin (Canada-USA). Bulletin of Canada Petroleum Geologist, 1996, 44(3): 429-445. [Cited Within:1]
[25]
OSADETZ KG, SNOWDON LR. Significant Paleozoic petroleum source rocks in the Canadian Williston Basin: Their distribution, richness and thermal maturity (southeastern Saskatchewan and southwestern Manitoba). Ottawa-Ontario: Natural Resources Canada, 1995. [Cited Within:3]
[26]
JIANGC, LIM. Bakken/Madison petroleum systems in the Canadian Williston Basin, Part 3: Geochemical evidence for significant Bakken-derived oils in Madison Group reservoirs. Organic Geochemistry, 2002, 33(7): 761-787. [Cited Within:1]
[27]
OSADETZ KG, MORTA, SNOWDON LR, et al. Western Canada sedimentary basin petroleum systems: A working and evolving paradigm. Interpretation, 2018, 6(2): 1-36. [Cited Within:2]
[28]
SCHMOKER JW, HESTER TC. Organic carbon in Bakken Formation, United States portion of Williston Basin. AAPG Bulletin, 1983, 67(12): 2165-2174. [Cited Within:2]
[29]
PRICE LC, LEFEVER JA. Does Bakken horizontal drilling imply huge oil-resource bases in fractured shales. In: ROBINSON J W, LEFEVER J A, GASWIRTH S B. The Bakken- Three Forks petroleum system in the Williston Basin. Denver, Colo. : Rocky Mountain Association of Geologists, 2011. [Cited Within:1]
[30]
CARLISLEJ, DRYFFL, FRYTM, et al. The Bakken Formation: An integrated geologic approach to horizontal drilling. In: ROBINSON J W, LEFEVER J A, GASWIRTH S B. The Bakken-Three Forks petroleum system in the Williston Basin. Denver, Colo. : Rocky Mountain Association of Geologists, 2011. [Cited Within:1]
[31]
KUHN PP, DI PRIMIOR, JAMES RH, et al. Three-dimensional modeling study of the low-permeability petroleum system of the Bakken Formation. AAPG Bulletin, 2012, 96(10): 1867-1897. [Cited Within:2]
[32]
CHENZ, OSADETZ KG, JIANGC, et al. Spatial variation of Bakken/Lodgepole oils in the Canadian Williston Basin. AAPG Bulletin, 2009, 93(6): 829-851. [Cited Within:5]
[33]
STASIUK LD. Petrographic thermal maturity assessment of Winnipegosis (Middle Devonian) and Bakken (Devonian— Mississippian) formations, southeastern Saskatchewan. Bulletin of Canadian Petroleum Geology, 1994, 42(2): 178-186. [Cited Within:1]
[34]
KOHLRUSSD, NICKELE. Facies analysis of the Upper Devonian—Lower Mississippian Bakken Formation, southeastern Saskatchewan. In: Summary of investigations 2009, Volume 1: Saskatchewan geological survey. Saskatchewan: Saskatchewan Ministry of Energy and Resources, 2009. [Cited Within:2]
[35]
KOHLRUSSD, NICKELE. Bakken Formation of southeastern Saskatchewan: Selected stratigraphy and production maps. Saskatchewan: Saskatchewan Ministry of the Economy, 2013[Cited Within:2]
[36]
SLUIJKD, PARKER JR. Comparison of predrilling with post-drilling outcomes, using Shell’s prospect appraisal system. In: RICE D D. Oil and gas assessment: Methods and applications. Tulsa: AAPG, 1985. [Cited Within:1]
[37]
GHADER SM, CLARKSONC, GHANIZADEHA, et al. Improved oil recovery in tight oil formations: Results of water injection operations and gas injection sensitivities in the Bakken Formation of Southeast Saskatchewan. SPE 185030 -MS, 2017. [Cited Within:1]
[38]
YUW, LASHGARI HR, WUK, et al. CO2 injection for enhanced oil recovery in Bakken tight oil reservoirs. Fuel, 2015, 159(1): 354-363. [Cited Within:1]
[39]
CANDERH. Finding sweet spots in shale liquids and gas plays, with lessons from the Eagle Ford Shale. Search and Discovery 40936, 2012. [Cited Within:1]
[40]
BELL JS, GRASBYS. The stress regime of the Western Canadian Sedimentary Basin. Geofluids, 2011, 12(2): 150-165. [Cited Within:1]
1
2016
0.0
0.0
... With the application of multi-stage hydraulic fracturing and horizontal well drilling, the oil production from the Bakken reservoir in that area has increased sharply from approximately 100 m3/day in 2004 to approximately 10 000 m3/day in 2014[1,2] ...
1
2018-04-01
0.0
0.0
... With the application of multi-stage hydraulic fracturing and horizontal well drilling, the oil production from the Bakken reservoir in that area has increased sharply from approximately 100 m3/day in 2004 to approximately 10 000 m3/day in 2014[1,2] ...
2
2018-04-01
0.0
0.0
... An assessment of the tight oil resources in the Middle Bakken of southeast Saskatchewan by the National Energy Board and Saskatchewan Geological Survey (2015)[3] completed recently estimated 223 #cod#x000D7 ...
... 9 TCF) of marketable natural gas[3] ...
2
2013
0.0
0.0
... can be developed profitably at an industrial scale[4,5,6] ...
... Several methods have been proposed for delineating production sweet spots in unconventional plays[4, 6,7] ...
1
2015
0.0
0.0
... can be developed profitably at an industrial scale[4,5,6] ...
2
2017
0.0
0.0
... can be developed profitably at an industrial scale[4,5,6] ...
... Several methods have been proposed for delineating production sweet spots in unconventional plays[4, 6,7] ...
1
2013
0.0
0.0
... Several methods have been proposed for delineating production sweet spots in unconventional plays[4, 6,7] ...
1
2016
0.0
0.0
... As the geological controls for commercial oil occurrence in the tight/shale reservoirs are not fully understood[8], the classic theories and simulation techniques applied to evaluating recoverable factors for conventional reservoirs have proven inadequate for tight reservoirs[9,10,11] ...
1
2010
0.0
0.0
... As the geological controls for commercial oil occurrence in the tight/shale reservoirs are not fully understood[8], the classic theories and simulation techniques applied to evaluating recoverable factors for conventional reservoirs have proven inadequate for tight reservoirs[9,10,11] ...
1
2012
0.0
0.0
... As the geological controls for commercial oil occurrence in the tight/shale reservoirs are not fully understood[8], the classic theories and simulation techniques applied to evaluating recoverable factors for conventional reservoirs have proven inadequate for tight reservoirs[9,10,11] ...
1
2017
0.0
0.0
... As the geological controls for commercial oil occurrence in the tight/shale reservoirs are not fully understood[8], the classic theories and simulation techniques applied to evaluating recoverable factors for conventional reservoirs have proven inadequate for tight reservoirs[9,10,11] ...
2
2006
0.0
0.0
... Statistical modelThe method presented in this study for sweet-spot mapping is an integrated statistical approach which regards the geological risk as a problem of two-category classification with uncertainty, and employs multivariable and Bayesian statistics to perform the classification [12] ...
... Chen and Osadetz[12] discussed the details of the Bayesian approach for deriving quantitative measurements for selecting diagnostic variables, so repetitious details aren#cod#x02019 ...
1
1989
0.0
0.0
... The geological favorability of a well site with capacity of economic production is measured as the MD, which is expressed as[13]: ...
1
2017
0.0
0.0
... The oil pore volume in reservoir conditions was converted to resource potential under standard surface conditions using the standard equation for conventional reservoir[14] ...
1
1945
0.0
0.0
... In this study, two production decline models, the Arps and Valko models[15,16] were adopted ...
2
2010
0.0
0.0
... In this study, two production decline models, the Arps and Valko models[15,16] were adopted ...
... The Valko model (also known as stretched exponential model), designed for unconventional reservoirs, can better characterize flow behavior in unconventional reservoirs [16,18] ...
1
2010
0.0
0.0
... The Arps model was proposed to predict production decline in conventional reservoirs, so when applied to unconventional tight reservoirs, it could overestimate the EURs[17] ...
1
2012
0.0
0.0
... The Valko model (also known as stretched exponential model), designed for unconventional reservoirs, can better characterize flow behavior in unconventional reservoirs [16,18] ...
2
1990
0.0
0.0
... 1) constituting two major sedimentary packages: (1) the Paleozoic carbonate and evaporate system, and (2) Mesozoic and Cenozoic siliciclastic system[19] ...
... There are several faults/faulted zones related to basement structures in the Williston Basin[19], of which some are probably dominant channels for oil migration from south to north[32] ...
1
1974
0.0
0.0
... The black shales of the upper and lower members are widespread in the basin[20,22,25] and thickest (more than 20 m) at the basin center, representing typical marine source rock[31], with measured total organic carbon (TOC) content from #cod#x0003C ...
1
1978
0.0
0.0
... The Bakken Formation from the top of the Devonian to the lower Mississippian is a set of proven source rocks and the major source for oil and gas in Carboniferous-age and overlying formations[21,22,23,24,25,26], so it has been the major interval of oil and gas exploration and development in the basin[27] ...
2
1985
0.0
0.0
... The Bakken Formation from the top of the Devonian to the lower Mississippian is a set of proven source rocks and the major source for oil and gas in Carboniferous-age and overlying formations[21,22,23,24,25,26], so it has been the major interval of oil and gas exploration and development in the basin[27] ...
... The black shales of the upper and lower members are widespread in the basin[20,22,25] and thickest (more than 20 m) at the basin center, representing typical marine source rock[31], with measured total organic carbon (TOC) content from #cod#x0003C ...
1
2005
0.0
0.0
... The Bakken Formation from the top of the Devonian to the lower Mississippian is a set of proven source rocks and the major source for oil and gas in Carboniferous-age and overlying formations[21,22,23,24,25,26], so it has been the major interval of oil and gas exploration and development in the basin[27] ...
1
1996
0.0
0.0
... The Bakken Formation from the top of the Devonian to the lower Mississippian is a set of proven source rocks and the major source for oil and gas in Carboniferous-age and overlying formations[21,22,23,24,25,26], so it has been the major interval of oil and gas exploration and development in the basin[27] ...
3
1995
0.0
0.0
... The Bakken Formation from the top of the Devonian to the lower Mississippian is a set of proven source rocks and the major source for oil and gas in Carboniferous-age and overlying formations[21,22,23,24,25,26], so it has been the major interval of oil and gas exploration and development in the basin[27] ...
... The black shales of the upper and lower members are widespread in the basin[20,22,25] and thickest (more than 20 m) at the basin center, representing typical marine source rock[31], with measured total organic carbon (TOC) content from #cod#x0003C ...
... Due to shallow burial depth in the Canadian portion of the Williston Basin, the Bakken black shales are not thermally mature enough to generate large amounts of oil and gas[25,32] ...
1
2002
0.0
0.0
... The Bakken Formation from the top of the Devonian to the lower Mississippian is a set of proven source rocks and the major source for oil and gas in Carboniferous-age and overlying formations[21,22,23,24,25,26], so it has been the major interval of oil and gas exploration and development in the basin[27] ...
2
2018
0.0
0.0
... The Bakken Formation from the top of the Devonian to the lower Mississippian is a set of proven source rocks and the major source for oil and gas in Carboniferous-age and overlying formations[21,22,23,24,25,26], so it has been the major interval of oil and gas exploration and development in the basin[27] ...
... The emergence of horizontal well drilling combined with multi-stage fracturing provides a feasible means for the recovery of tight oil from the Bakken Formation[27,28,29,30] ...
2
1983
0.0
0.0
... Schmoker and Hester[28] thought that the proven reserves in the conventional reservoirs of the basin only accounted for a small portion of the oil and gas expelled from Bakken Formation shale ...
... The emergence of horizontal well drilling combined with multi-stage fracturing provides a feasible means for the recovery of tight oil from the Bakken Formation[27,28,29,30] ...
1
2011
0.0
0.0
... The emergence of horizontal well drilling combined with multi-stage fracturing provides a feasible means for the recovery of tight oil from the Bakken Formation[27,28,29,30] ...
1
2011
0.0
0.0
... The emergence of horizontal well drilling combined with multi-stage fracturing provides a feasible means for the recovery of tight oil from the Bakken Formation[27,28,29,30] ...
2
2012
0.0
0.0
... The black shales of the upper and lower members are widespread in the basin[20,22,25] and thickest (more than 20 m) at the basin center, representing typical marine source rock[31], with measured total organic carbon (TOC) content from #cod#x0003C ...
... Canada border could be up to 80%[31], which is adequate for oil accumulation ...
5
2009
0.0
0.0
... Due to shallow burial depth in the Canadian portion of the Williston Basin, the Bakken black shales are not thermally mature enough to generate large amounts of oil and gas[25,32] ...
... There are several faults/faulted zones related to basement structures in the Williston Basin[19], of which some are probably dominant channels for oil migration from south to north[32] ...
... (2009)[32] studied the geochemical evidence of migration of Bakken and the overlying Carboniferous Lodgepole sourced oils ...
... s Williston Basin have high geochemical similarity with Bakken source rocks, and the oil might migrate along the Torquay-Rocanville Trend (TRT Lineament) toward the north[32], which passes right through the Viewfield oilfield ...
... [32] demonstrated that interbedding of thin silty and muddy shale was favourable for the enrichment and preservation of gas in the environment where the natural gas generation and escaping were in a dynamic equilibrium ...
1
1994
0.0
0.0
... The research results of Stasiuk[33] show the vitrinite reflectance of the samples (Ro) ranges between 0 ...
2
2009
0.0
0.0
... The Middle Bakken member in southeastern Saskatchewan has been subdivided into 3 sublayers, Unit A, Unit B and Unit C[34,35] from bottom to top ...
... Conformably overlying the Lower member Bakken[34,35], the Unit A consists of massive grey to greenish grey argillaceous dolomitic siltstone to silty dolostone, with many signs of bioturbation ...
2
2013
0.0
0.0
... The Middle Bakken member in southeastern Saskatchewan has been subdivided into 3 sublayers, Unit A, Unit B and Unit C[34,35] from bottom to top ...
... Conformably overlying the Lower member Bakken[34,35], the Unit A consists of massive grey to greenish grey argillaceous dolomitic siltstone to silty dolostone, with many signs of bioturbation ...
1
1985
0.0
0.0
... Sluijk and Parker (1985)[36] used a creaming curve to measure the exploration drilling efficiency of different drilling strategies in conventional petroleum exploration ...
1
2017
0.0
0.0
... Recent study[37] indicates that water flooding could be effective in enhancing recovery of the Middle Bakken tight oil reservoir ...
1
2015
0.0
0.0
... 43%[38] ...
1
2012
0.0
0.0
... 8%[39] ...
1
2011
0.0
0.0
... the direction of NE is coincident with the direction of the maximum regional horizontal stress field[40], and the fractures parallel with the direction of maximum regional horizontal stress field are likely to remain open under the effect of the stress field, which is conducive to oil migration along this direction ...
Production characteristics and sweet-spots mapping of the Upper Devonian-Lower Mississippian Bakken Formation tight oil in southeastern Saskatchewan, Canada
[CHEN Zhuoheng1,*, YANG Chao2, JIANG Chunqing1, KOHLRUSS Dan2, HU Kezhen1, LIU Xiaojun1, YURKOWSKI Melinda2]


 , YANG Chao